Indoor Golf Simulator ROI for Golf Centers: Cost, Space and Revenue Estimates
Indoor Golf Simulator ROI for Golf Centers: Cost, Space and Revenue Estimates to Plan Payback (revenue per simulator hour estimates, indoor golf simulator roi)
A single premium simulator can cost as much as a small car. Will it pay you back in 12 months or stall in year two? This guide walks you through realistic indoor golf simulator ROI scenarios, an itemized cost and maintenance checklist, precise bay specs you can hand to a landlord or contractor, and pricing/revenue models (membership vs pay‑per‑play) with sensitivity analysis.
You’ll get:
– Three modeled ROI pro‑formas (conservative, moderate, aggressive) with payback timelines and sensitivity to utilization and pricing.
– A line‑by‑line capital and one‑year operating budget plus a practical simulator maintenance cost checklist.
– Exact bay footprint, ceiling heights, ADA/egress, HVAC and retrofit guidance for retail, warehouse and golf‑center shells.
– Comparative economics for membership vs pay‑per‑play vs hybrid models and ancillary revenue tactics that move the needle.
1 — Capital Costs and One‑Year Operating Budget
Operators often focus on purchase price and skip the rest. This section lays out the full installed cost picture—one‑time capital items and the recurring operating burden you must budget for in year one.
Itemized upfront costs (data‑driven line items)
Below are the common one‑time capital items with realistic ranges. Sources: vendor price lists (Full Swing, TrackMan, Foresight, AboutGolf), contractor quotes, and installer case studies.
- Simulator hardware
- Entry commercial (single sensor or basic photometric): $10,000–$25,000
- Mid‑range (multi‑sensor or improved launch monitor): $25,000–$60,000
- Premium (top tier TrackMan/Full Swing multi‑sensor + proprietary integration): $60,000–$100,000+
- According to vendor price lists (Full Swing, TrackMan, Foresight), commercial systems range from roughly $10,000 to well over $100,000 per bay depending on sensors and licensing.
- Enclosure & impact screen
- Basic enclosure + screen: $1,500–$6,000
- Premium boxed bays with framing, lighting, and custom graphics: $6,000–$15,000
- Projector / AV + mounts
- Short‑throw projector and mounts: $800–$6,000 depending on brightness and throw ratio
- Sound system: $300–$2,000
- Computer / software license
- Workstation and GPU: $1,200–$4,000
- Software license / initial activation: $1,000–$5,000 (some vendors charge ongoing subscription instead)
- Installation & calibration labor
- On‑site setup, calibration, and training: $500–$4,000 (varies by travel, complexity)
- Network/AV cabling, power upgrades
- Cabling, ports, single dedicated 20A circuit, surge protection: $300–$2,500
- Electrical upgrade (if panel work needed): $500–$3,500
- Permits, taxes, and insurance rider (if required)
- Local permitting and small business filings: $0–$1,500
- Construction/fit‑out per bay
- Basic fit‑out (flooring, paint, enclosure trim): $2,000–$6,000 per bay
- Premium fit‑out (acoustics, custom walls, HVAC balancing): $6,000–$15,000 per bay
- Installer and contractor quotes indicate fit‑out per bay commonly ranges $2,000–$15,000 depending on finish level.
Tip: For budgeting, assume total installed capital between $25k (bare‑bones) and $80k (mid/high quality) per bay in most U.S. commercial builds. For premium flagship locations, plan higher.
Internal resource: see small business operations tips for budgeting and staffing guidance (Small business operations tips).
Recurring annual & monthly operating costs
Recurring costs are where profit can evaporate if you under‑budget. Typical annual recurring items include:
- Software subscriptions and content licensing: $300–$3,000/year per bay (some vendors charge monthly).
- Calibration/service contracts: $300–$2,500/year per bay.
- Impact screen replacement (life depends on usage): $200–$1,200 every 2–6 years; budget annualized amount $50–$600.
- Projector lamp replacement or service: $100–$800/year (or more for high‑brightness lamps).
- Small parts & sensors replacements (cables, mounts): $100–$1,000/year.
- Cleaning supplies & consumables (sanitizer, mats, turf segments): $50–$300/month.
- Utilities (electricity for projector, PC, climate control): $10–$60/month per bay depending on local rates and HVAC load.
- Payment processing and booking fees: 2–5% of revenue + fixed per‑transaction fees.
- Labor: per‑bay labor depends on multi‑use staff and scheduling—allocate a share of employee wages to each bay.
According to vendor service contract quotes and operator reports, total annual maintenance & software licensing commonly falls in the $500–$5,000/year per bay range.
Example monthly and annual totals (modeled):
– Entry system (lower capex, minimal subscriptions): $75/month — $900/year
– Mid system (moderate licenses + service contract): $250/month — $3,000/year
– Premium system (multi‑sensor, annual calibration, premium software): $420/month — $5,000/year
Capital depreciation, financing options & tax considerations
- Financing: common terms for equipment loans are 24–60 months. At 6–10% interest, monthly payments will materially affect cash flow. Example: $50,000 financed over 48 months at 7% = ~$1,200/month.
- Leasing/OPEX: subscription/lease treatments can shift CapEx to Opex and simplify upgrades.
- Tax & depreciation: Section 179 or bonus depreciation (when applicable) can accelerate write‑offs; consult a tax advisor for current rules.
Quick cash‑flow note: When modeling indoor golf simulator roi, include debt service and conservatively estimate 10–20% schedule slippage or additional integration costs.
2 — Space, Build & Retrofit Requirements for Commercial Bays
Precise footprint and ceiling height specs prevent surprises with landlords and installers.
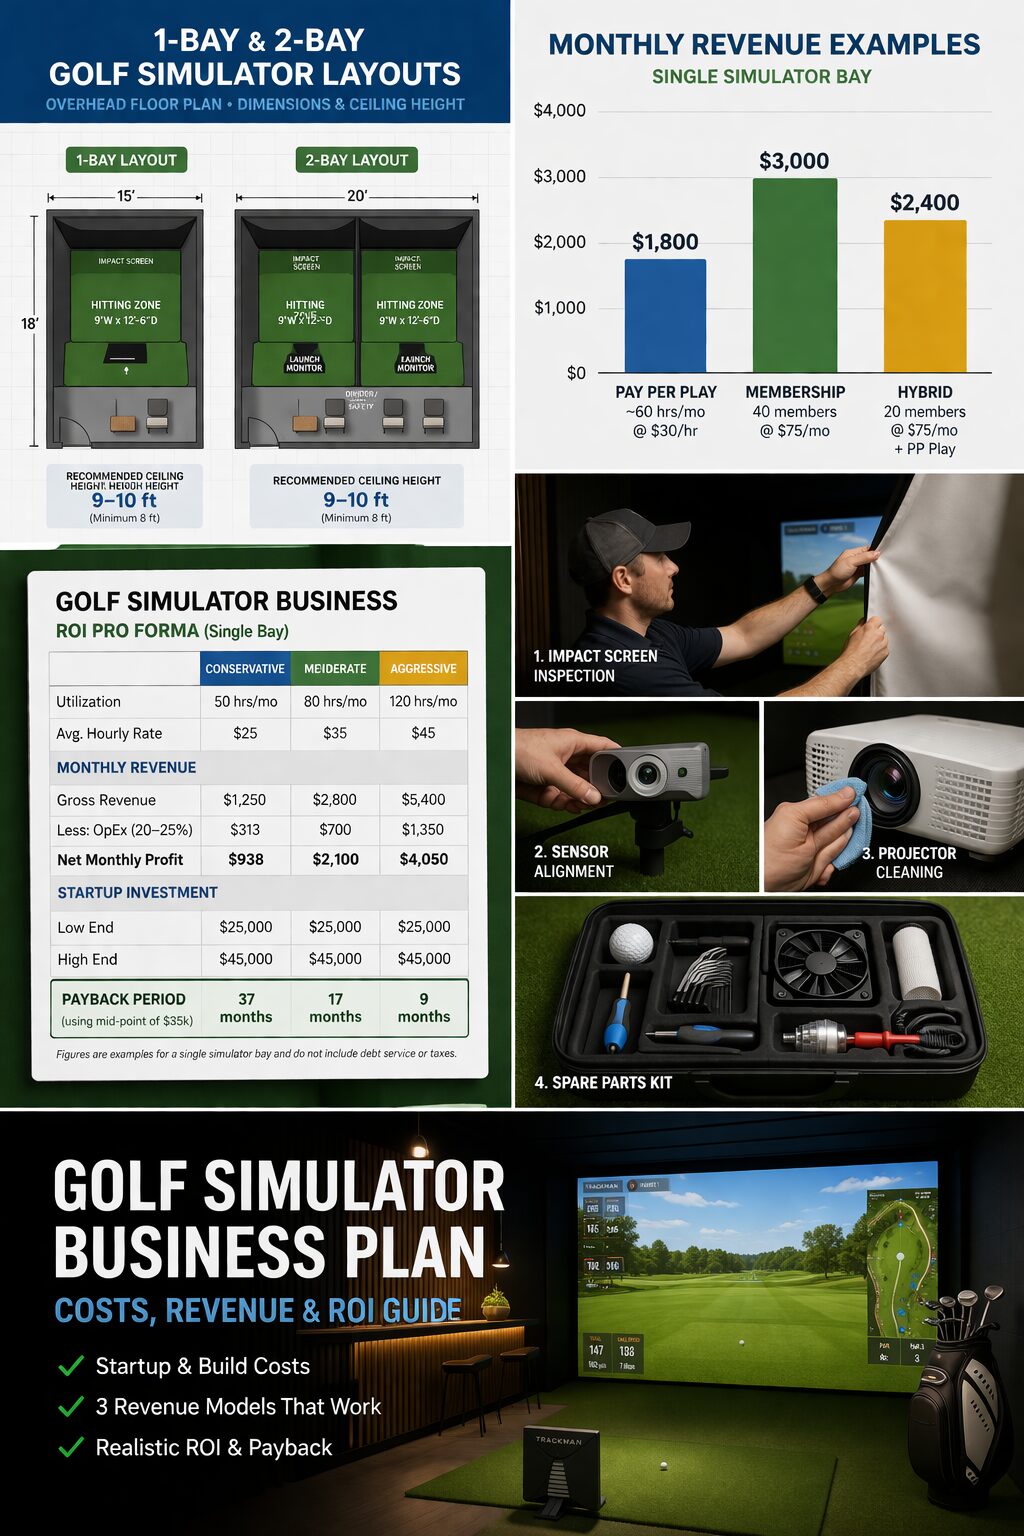
A single full‑swing bay recommended footprint: 10–12 ft (width) × 15–18 ft (depth). Preferred ceiling height for full swings: 10–12 ft minimum. Dual‑bay modules require more width and careful sightline planning. These are consistent with manufacturer spec sheets (TrackMan, Foresight, Full Swing) and trade installation guides.
Precise bay footprint and ceiling height requirements
- Single bay (full‑swing): 10–12 ft W × 15–18 ft D; ceiling 10–12 ft recommended.
- Compact / swing‑only bays (limited backswings or chipping stations): 9 ft W × 12 ft D; 9–10 ft ceiling possible with modified nets.
- Dual bay (side‑by‑side): 20–24 ft W × 15–18 ft D; consider shared walkway and staggered projector mounts.
- Depth is often more critical than width—allow extra depth for player backswings and safety buffer (minimum 2–3 ft behind the hitting area).
Manufacturers and installers recommend a 10–12 ft ceiling for true full‑swing play with drivers and for projector clearance, though some ceiling‑mounted net solutions can work in 9 ft spaces with restricted club selection.
ADA, egress, HVAC, lighting, and AV/networking considerations
Checklist for code and comfort:
– ADA access: clear pathways to bays, one accessible bay in facilities with multiple bays; doorways and approaches per ADA dimensions.
– Egress: required exit routes and travel distance per local code—don’t block egress with modular walls.
– HVAC: enclosed bays increase heat load and reduce air exchange. For clusters of bays, balance with zone HVAC; consider 4–6 air changes/hour for comfort during events. Consult an HVAC contractor for CFM calculations; installers report that enclosed bays can increase HVAC run time by 10–25%.
– Electrical: short‑throw projectors and PCs typically need a dedicated 15–20A circuit with surge protection. If multiple bays are in one room, plan for panel capacity.
– Sound: acoustic baffling or absorptive panels reduce cross‑bay bleed during lessons/leagues.
– Network: wired Ethernet preferred for stability; plan a dedicated switch with PoE for cameras/sensors if used.
– Lighting: avoid direct glare on screens; use dimmable indirect lighting. Install blackout curtains or light‑blocking materials for rooms with exterior windows.
Internal resource: pair bay layout planning with digital marketing strategies for golf centers to optimize customer flow and visibility (digital marketing strategies for golf centers).
Retrofit guidance for common building types
Retail unit conversion (strip mall storefront)
– Benefits: street visibility, foot traffic. Challenges: low ceiling height, existing HVAC capacity.
– Typical fit‑out: install framed enclosure, blackout, short‑throw projector mounting, flooring. Budget: $4k–$12k per bay.
– Timeline: 2–6 weeks for a single bay.
Warehouse shell or light industrial
– Benefits: high ceilings (often 12–20 ft), flexible floor plan, lower rent/sq ft.
– Challenges: HVAC zoning, open acoustics, more expensive partitioning.
– Fit‑out cost: $3k–$15k per bay for enclosures and HVAC balancing; allow for electrical upgrades.
– Timeline: 4–12 weeks depending on permitting.
Existing indoor golf center expansion
– Benefits: shared amenities (restrooms, F&B), existing customer base.
– Challenges: integration with existing routing, service windows.
– Typical steps: coordinate sensor placement to minimize interference, standardize software across bays to simplify bookings.
– Fit‑out cost: often lower per bay due to shared systems—budget $2k–$8k per bay.
Practical contractor tip: Ask for a line‑item quote separating structural work, electrical, HVAC, and AV so you can re‑use or upgrade components in future expansions.
3 — Revenue Models: Membership vs Pay‑Per‑Play vs Hybrid
Choosing the right pricing mix is the single biggest lever you control. Below we break down revenue math, membership economics, and hybrid approaches with modeled per‑hour outcomes.
Pricing frameworks and per‑hour revenue math
Formula basics:
– Revenue per hour = Hourly rate × Hours sold
– Revenue per available hour (RevPAH) = Total revenue / Available hours (usually 12–16 hours/day depending on schedule)
– Utilization % = Hours sold / Total available hours
Industry reported hourly price range: $15–$100/hour depending on price model (member discounted rate, public rate, lessons, or premium events). According to operator pricing and trade interviews, most centers price public play $30–$60/hr, with member rates $10–30/hr (or included in membership packages).
Example calculations (simple):
– Walk‑in pay‑per‑play at $40/hr, average 6 booked hours/day = $240/day = $7,200/month (30 days)
– Membership model: 200 members × $50/mo = $10,000/mo; if members average 1 hour/week each and are counted across multiple bays, allocation matters.
Membership model vs pay‑per‑play — pros, cons and churn economics
Pros and Cons
Advantages (Membership model)
– Predictable recurring revenue and cash flow.
– Smoother utilization—members fill off‑peak hours.
– Higher customer lifetime value (CLV) when paired with secondary spend.
Disadvantages
– Administrative overhead (billing, churn management).
– Risk of underutilized service if members don’t show.
– Need strong retention tactics (events, content, member perks).
Advantages (Pay‑per‑play)
– Simplicity—customers only pay when they come.
– No long‑term commitment barrier for casual players.
– Easier to price dynamically for peak vs off‑peak.
Disadvantages
– Revenue is less predictable; more marketing required to achieve baseline utilization.
– Loyalty and high CLV building is slower.
Short numerical example (modeled):
– 200 members at $50/mo = $10,000/month.
– Equivalent pay‑per‑play revenue for same customer hours (assuming 1 hr/week per member = 800 hours/month) at $40/hr = $32,000/month—so pricing must be tiered; memberships usually trade lower per‑hour revenue for predictability and engagement.
Internal resource: pair membership selling with sales & outreach scripts for promoting memberships to convert walk‑ins into recurring revenue (sales & outreach scripts for promoting memberships).
Hybrid models and events/leagues/lessons as revenue multipliers
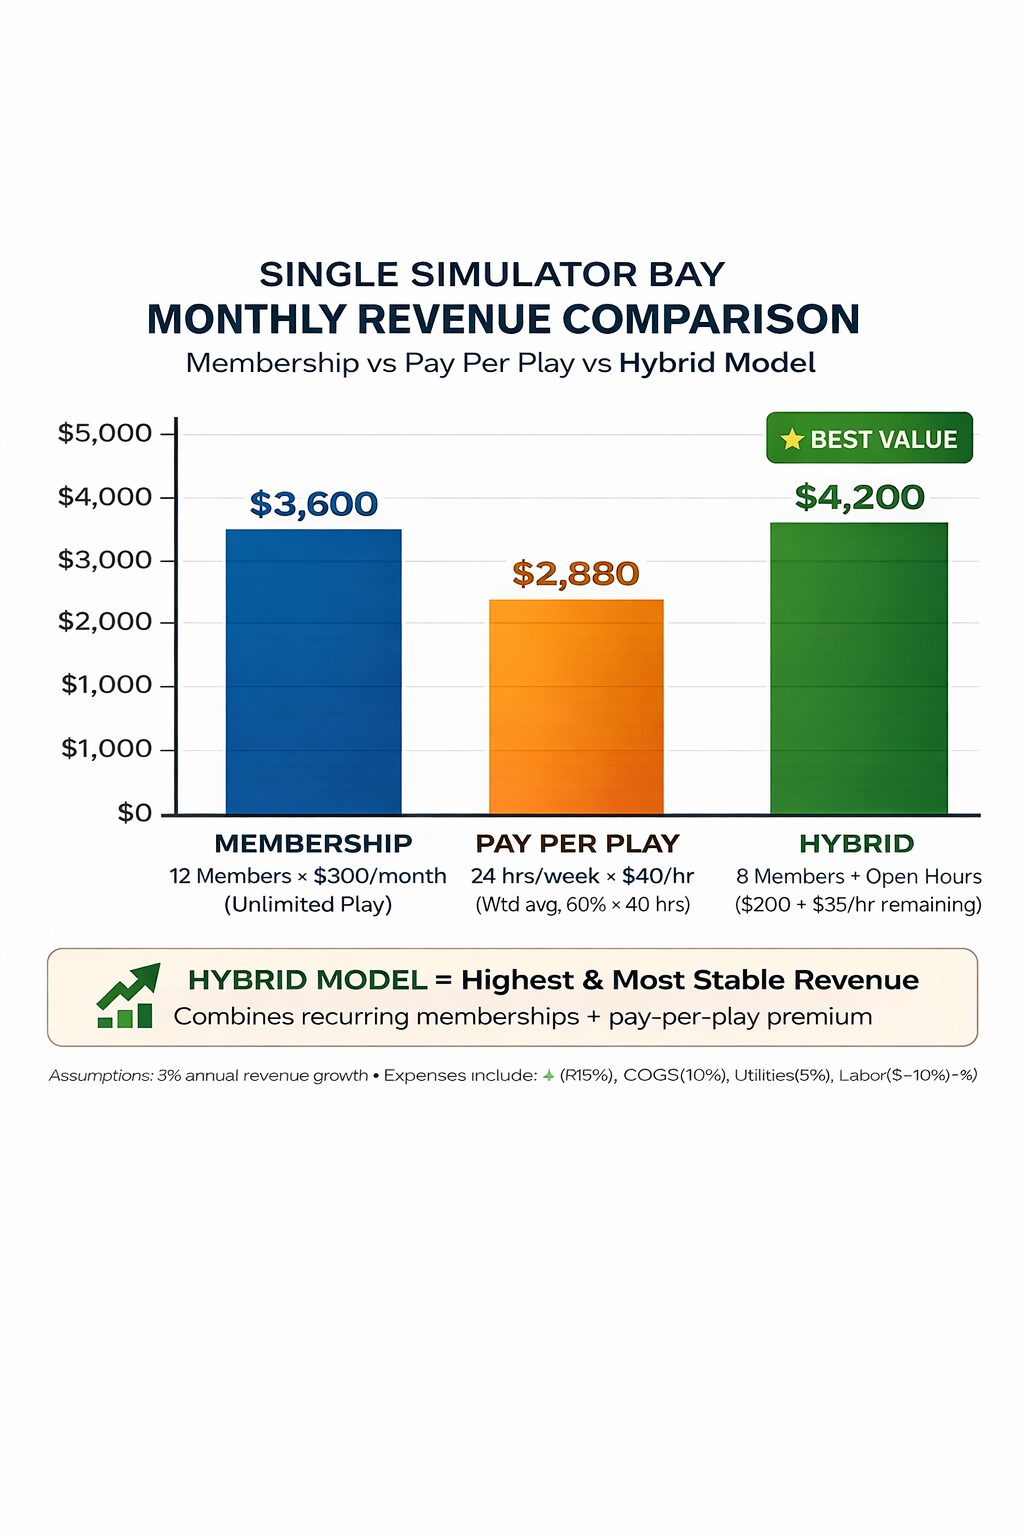
Hybrid = base membership revenue + pay‑per‑play walk‑ins + instructor hours + events/leagues + F&B/retail.
Common structure:
– Base membership (monthly fee) includes X hours or discounts.
– Pay‑per‑play rates for peak or non‑members.
– Lesson blocks sold by the hour at 1.5–3× standard hourly rate (lessons often priced by instructor).
– Weekly leagues and corporate events at premium hourly packages.
– Ancillary: F&B, retail (gloves, balls, apparel), and screen advertising.
Ancillary revenue contribution: operator case studies and trade reports indicate F&B and lessons can add 20–50%+ to per‑bay revenue in profitable facilities. For example, a center selling $7,000/mo in bay revenue may add $1,500–$3,500 in ancillary sales with active coaching programs and basic F&B.
Tactics to increase yield:
– Sell lesson packages and prepaid blocks (increase upfront cash).
– Offer dynamic pricing: lower off‑peak rates to fill slow hours.
– Host weekly leagues to create repeat bookings and social stickiness.
4 — ROI Pro‑formas & Sensitivity Analysis
This section gives three modeled pro‑formas (example numbers) and a sensitivity analysis showing what moves payback the most. These are modeled examples using typical industry inputs and vendor ROI calculators; adjust with your local rent, wages, and utility rates.
Three scenario pro‑formas (conservative, moderate, aggressive)
Assumptions common to all scenarios:
– Available hours per bay: 12 hours/day × 30 days = 360 hrs/month (conservative centers often assume fewer available hours; adjust for your schedule).
– Annual operating days: 360 (allowing some downtime).
– Annual hours available: 4,320 hours (12 × 360).
– We’ll report results as annual numbers and simple payback.
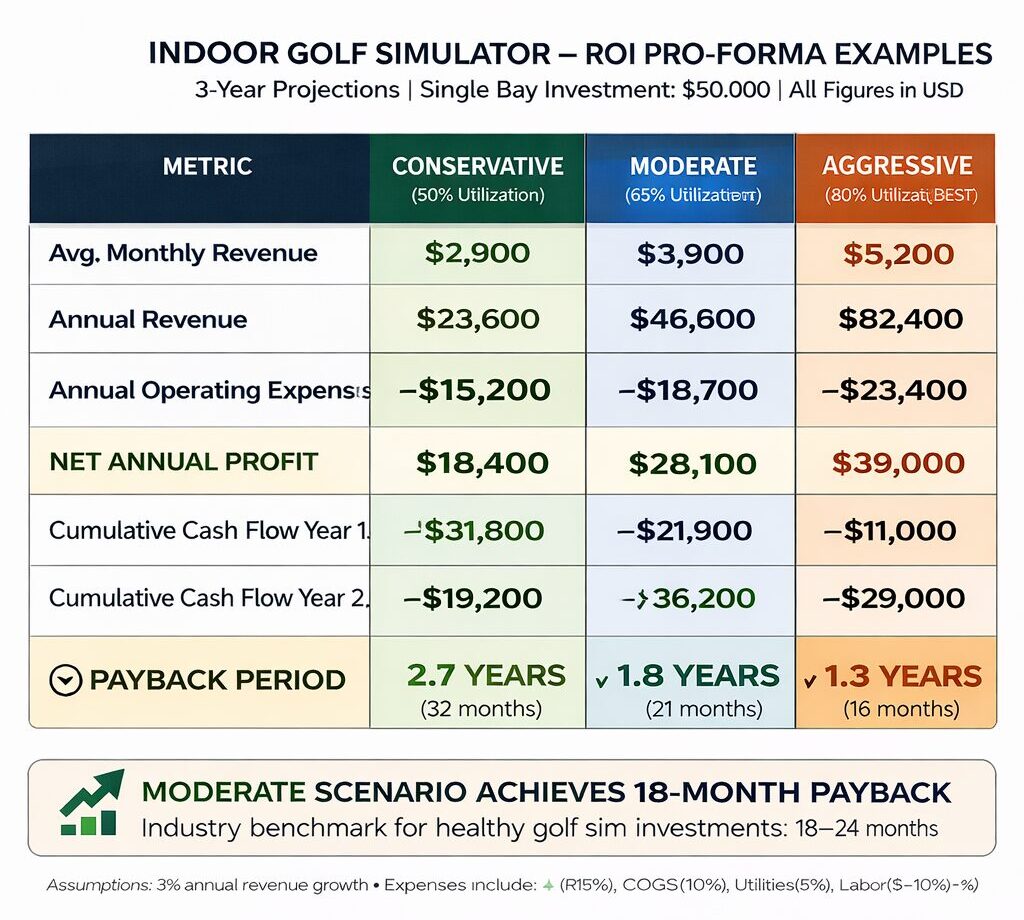
Scenario A — Conservative
– CapEx installed: $45,000
– Annual fixed & recurring costs: $9,600 (licenses, maintenance, utilities, small parts)
– Average realized hourly revenue: $25/hr (low mix of members and walk‑ins)
– Utilization: 15% (648 hours/year)
– Annual revenue: 648 × $25 = $16,200
– Annual operating profit before debt service: $16,200 − $9,600 = $6,600
– Payback: $45,000 / $6,600 ≈ 6.8 years (not including financing) — this shows why low utilization kills ROI.
Scenario B — Moderate
– CapEx: $55,000
– Annual costs: $12,000
– Average hourly revenue: $40/hr
– Utilization: 25% (1,080 hrs/year)
– Annual revenue: 1,080 × $40 = $43,200
– Operating profit: $43,200 − $12,000 = $31,200
– Payback: $55,000 / $31,200 ≈ 1.8 years
Scenario C — Aggressive
– CapEx: $75,000 (premium system + premium fit‑out)
– Annual costs: $18,000 (higher subscriptions, service contracts)
– Average hourly revenue: $60/hr (higher lesson and event mix)
– Utilization: 35% (1,512 hrs/year)
– Annual revenue: 1,512 × $60 = $90,720
– Operating profit: $90,720 − $18,000 = $72,720
– Payback: $75,000 / $72,720 ≈ 1.03 years
Notes:
– These are modeled examples and should be run in a downloadable spreadsheet with your local lease, payroll, and pricing.
– According to vendor ROI calculators and operator pro‑formas, typical payback windows in practice range 1–4 years for well‑run facilities and longer when utilization is low.
Sensitivity analysis: utilization and pricing levers
Which variables move payback most? In modeled sensitivity (tornado analysis), the top levers are:
1. Utilization rate — largest impact. A 10 percentage point increase often halves payback time.
2. Average realized hourly rate — second largest; raising rates for peak windows or lessons improves profit per hour.
3. CapEx — large fixed effect; a $10k reduction in capex shifts payback materially but less than utilization changes.
4. Recurring maintenance costs — smaller effect but still meaningful if contracts are expensive.
Break‑even utilization examples (modeled)
– For a mid system (CapEx $55k, annual costs $12k) charging $40/hr, break‑even utilization (zero operating profit) is around 9–12% of available hours. Operators commonly cite break‑even utilization 20–40% depending on price and cost structure.
KPI dashboard & what to track weekly/monthly
Track these metrics religiously:
– Utilization % (weekly & monthly)
– Revenue per available hour (RevPAH)
– Average spend per visit (including ancillary revenue)
– Membership count and churn rate
– Booking lead time and no‑show rate
– Equipment downtime and mean time to repair (MTTR)
– Cost per booking (marketing ad spend allocated)
Internal resource: combine KPI tracking with small business operations tips for staffing and scheduling efficiency (small business operations tips).
5 — Maintenance Checklist, Service SLAs & Best Practices
Keywords: simulator maintenance cost checklist, commercial golf simulator pricing
Maintenance decisions determine uptime, customer satisfaction, and long‑term economics. Below is a practical, technician‑friendly maintenance checklist, an estimated spare‑parts inventory, and guidance on contracts versus ad‑hoc repairs.
Monthly, quarterly, annual maintenance checklist
Concrete checklist with typical intervals (best practice):
Daily / After‑each shift
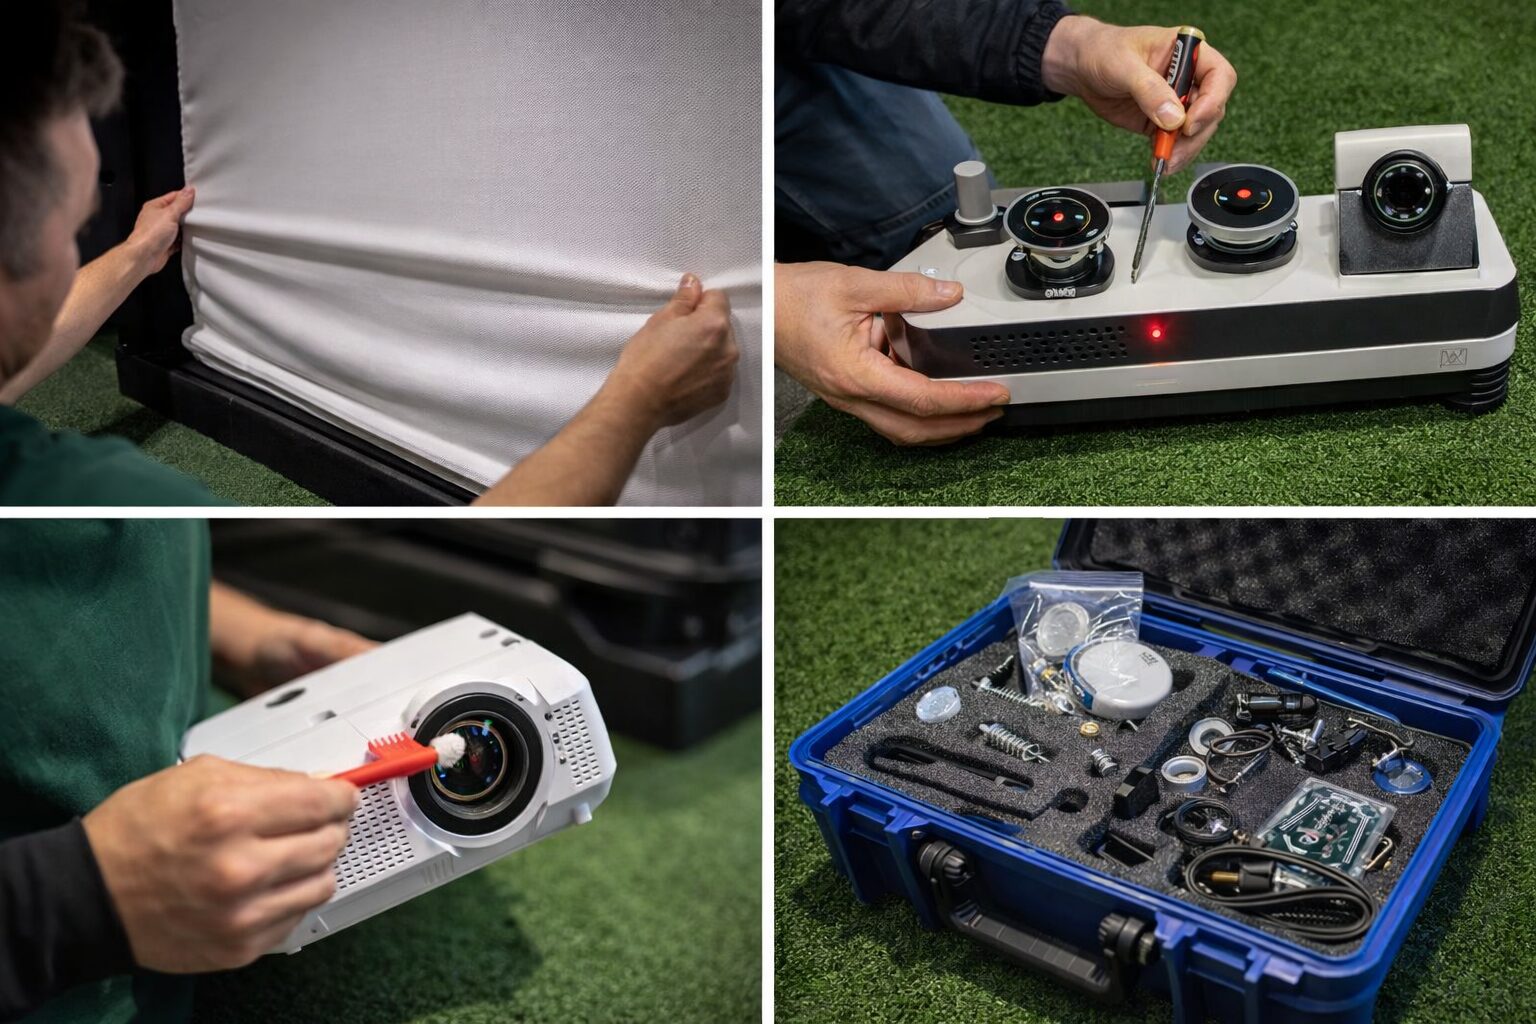
– Quick visual check for debris or tears on impact screen.
– Confirm projector alignment and screen image centering.
– Wipe high‑touch surfaces and sanitize club grips.
– Check booking system for no‑shows & note any software warnings.
Weekly
– Vacuum/brush turf and clean hitting mat edges.
– Inspect sensor housings and cable connections.
– Verify projector filter is clean (if applicable).
– Test emergency stop / safety net attachment.
Monthly
– Perform sensor alignment test and calibration run (log results).
– Clean projector lens and caps; inspect mounts.
– Inspect AV connections and Ethernet stability.
– Check spare parts inventory and order low items.
Quarterly
– Replace projector filters or lamps as needed (or as manufacturer recommends).
– Full software update and license verification.
– Inspect impact screen tension and seam integrity.
– HVAC filter replacement and verify bay air circulation.
Annual
– Full system calibration by trained technician (recommended SLAs).
– Replace impact screen if heavy wear (typical 2–6 year life dependent on use).
– Replace worn turf sections and re‑paint enclosure if needed.
– Review warranty & service contract renewals.
Estimated costs (annualized)
– Entry system: $500–$1,200/year
– Mid system: $1,500–$3,000/year
– Premium system: $3,000–$5,000+/year
These ranges reflect software subscriptions, calibration visits, minor replacements and consumables. Vendor maintenance guides and service quotes support the $500–$5,000/year range.
Best practices / Key takeaways
– Maintain documented calibration logs with timestamps and technician notes.
– Schedule maintenance windows (e.g., early weekday mornings) and communicate with members to reduce friction.
– Keep a small spare parts kit on hand (see below) to avoid multi‑day downtimes.
Internal resource: create content marketing around maintenance days and lessons using creating content to market events and memberships to keep members informed and engaged (creating content to market events and memberships).
Troubleshooting common failures and spare parts guide
Common issues and quick fixes:
– Sensor misalignment: often fixed by re‑running automated alignment or a technician realignment; downtime 30–120 minutes if in‑house.
– Projector lamp failure: swap spare lamp or engage service—downtime varies (plan spare if high‑use).
– Network dropouts: check PoE switch, Ethernet runs, and replace cheap patch cables first.
– Impact screen tears: small tears can be patched; full replacement can take 1–3 days plus cost.
– Software license errors: often require vendor remote support; ensure a vendor SLA.
Recommended spare parts inventory
– Replacement impact screen (or vendor listed patch kit)
– Extra projector lamp
– Spare Ethernet patch cables and surge protectors
– Replacement HDMI/DisplayPort cables and adapters
– Basic tool kit, spare screws/mounting hardware
Choosing service contracts vs ad‑hoc repairs
Pros/cons:
– Service contracts: predictable costs, faster vendor support, often include calibration. Good for premium systems and locations where downtime costs are high.
– Ad‑hoc repairs: lower variable cost but risk long downtime and potentially higher long‑term cost.
Recommended approach
– Hybrid: contract for annual calibration and critical sensor SLA; perform cleaning and basic fixes in‑house.
– Negotiate SLA clauses for response times, included travel, and firmware update coverage.
Best Practices (Actionable Recommendations)
- Build three pro‑formas (conservative/moderate/aggressive) and run sensitivity to utilization and average hourly rate weekly.
- Aim for a baseline utilization target of 25%+ to hit 2‑year payback on mid setups—lower targets require stronger ancillary revenue.
- Sell lesson blocks and events to push effective hourly yield higher—coach time sells at premium rates.
- Keep a documented calibration log and schedule annual vendor calibration to minimize silent sensor drift.
- Use dynamic pricing: discount off‑peak hours and create member perks to improve off‑peak utilization.
- Design bays with at least 10–12 ft ceiling for full‑swing; retrofit only with safety/club restrictions if below that.
- Negotiate service SLAs covering calibration and response times; use hybrid in‑house + contract approach for cost control.
- Track RevPAH and membership churn weekly—these two KPIs predict profitability faster than revenue alone.
Pros and Cons — Quick Summary
Advantages
- Year‑round revenue, weather‑independent play.
- High per‑square‑foot revenue potential when optimized.
- Ancillary revenue (F&B, lessons) compounds profitability.
Disadvantages
- High upfront capex for premium systems.
- Upside is tightly coupled to utilization and pricing sophistication.
- Maintenance and calibration requirements are non‑trivial.
Frequently Asked Questions
Q: How much does a commercial golf simulator bay cost to install?
A: Typical installed cost ranges widely. Bare‑bones setups can be around $12,000, while premium multi‑sensor systems with a high‑end fit‑out exceed $120,000. Most commercial installs fall between $25,000 and $60,000 per bay, depending on hardware choice and fit‑out level. Vendor price lists (Full Swing, TrackMan, Foresight) validate the wide range.
Q: What ceiling height and space do I need for a full‑swing bay?
A: Plan on roughly 10–12 ft ceiling height and a floor footprint of about 10–12 ft (width) × 15–18 ft (depth) for a single full‑swing bay. Some compact installs can work with lower ceilings if you limit driver use; check manufacturer spec sheets for exact clearances.
Q: What is a reasonable hourly price and utilization target?
A: Hourly pricing typically ranges $15–$100/hr depending on market, membership discounts, lessons, and events. Aim for utilization of 20–35% to reach reasonable payback timelines in most mid‑capex models; break‑even often occurs in the 20–40% utilization band depending on pricing.
Q: How long before I see ROI?
A: Typical payback across modeled operator pro‑formas is 1–4 years. Well‑executed locations with memberships, lessons, and events lean toward the 1–2 year range; poorly utilized setups can take much longer.
Q: What ongoing maintenance costs should I budget?
A: Budget $500–$5,000/year per bay to cover software licenses, periodic calibration, minor parts and cleaning. Premium systems with dedicated service contracts are toward the higher end of that range.
Q: Should I buy service contracts or handle repairs in‑house?
A: Service contracts reduce downtime and provide predictable costs which matter for premium systems and busy centers. A hybrid approach—vendor contract for calibration and critical fixes plus in‑house for cleaning and small repairs—often gives the best ROI.
Q: What ancillary revenue streams move the needle fastest?
A: Lessons/coaching and F&B are the highest‑impact ancillaries and can add 20–50%+ to per‑bay revenue when properly executed. Events, corporate bookings, and retail are also valuable but often take more sales effort.
Conclusion
Indoor golf simulator roi is achievable, but it’s not automatic. The three pro‑formas above show realistic payback windows driven primarily by utilization and per‑hour yield. Control the variables you can: set thoughtful pricing (a hybrid of memberships + pay‑per‑play), push ancillary revenue (lessons, F&B, events), and run disciplined maintenance to maximize uptime.
Next steps:
1. Download the pro‑forma template and run these scenarios with your local rent and wage numbers.
2. Use the bay specs here and schedule a site walkthrough with an installer to validate fit‑out costs.
3. Ramp membership sales using sales & outreach scripts for promoting memberships and boost local visibility with local SEO and online promotions.
Internal resources worth reading next:
– digital marketing strategies for golf centers (Key Online Marketing Recommendations To Increase Your Business)
– sales & outreach scripts for promoting memberships (Cold calls: I went from nothing to $120k/year solo using this process. Script included.)
– small business operations tips (Smart Advice For Your Home Business Success)
– creating content to market events and memberships (Excellent Writing A Blog Tips: A Smart Place To Start!)
– local SEO and online promotions (Internet Marketing Tips That Will Make A Difference)
Sources & Further Reading
- Manufacturer spec sheets & price lists — TrackMan, Full Swing, Foresight Golf, AboutGolf (manufacturer websites and published pricing guides).
- Installer and contractor case studies — trade installation guides and contractor quotes collected from industry installers (installation case studies).
- Trade publications — Golf Business Magazine, Global Golf Advisors (industry analysis and operator interviews).
- Vendor ROI calculators and operator pro‑formas — vendor calculators (TrackMan/Full Swing) and published operator examples (vendor ROI calculators).
- Service contract quotes and maintenance guides — vendor maintenance documentation and service contract quotes (vendor maintenance guides).
- Internal PAPublishing resources:
- Cold calls: I went from nothing to $120k/year solo using this process. Script included. (https://www.papublishing.com/cold-calls-i-went-from-nothing-to-120k-year-solo-using-this-process-script-included/)
- Key Online Marketing Recommendations To Increase Your Business (https://www.papublishing.com/key-online-marketing-recommendations-to-increase-your-business/)
- Smart Advice For Your Home Business Success (https://www.papublishing.com/smart-advice-for-your-home-business-success/)
- Excellent Writing A Blog Tips: A Smart Place To Start! (https://www.papublishing.com/excellent-writing-a-blog-tips-a-smart-place-to-start!)
- Internet Marketing Tips That Will Make A Difference (https://www.papublishing.com/internet-marketing-tips-that-will-make-a-difference/)
(For exact vendor pricing and the most recent spec sheets, consult vendor sites and request installer quotes—prices and product offerings evolve frequently.)